I’m a software developer at JRC and I would like to briefly talk about the charting application that we have developed here at JRC that I feel greatly benefits our students and clients and our staff.
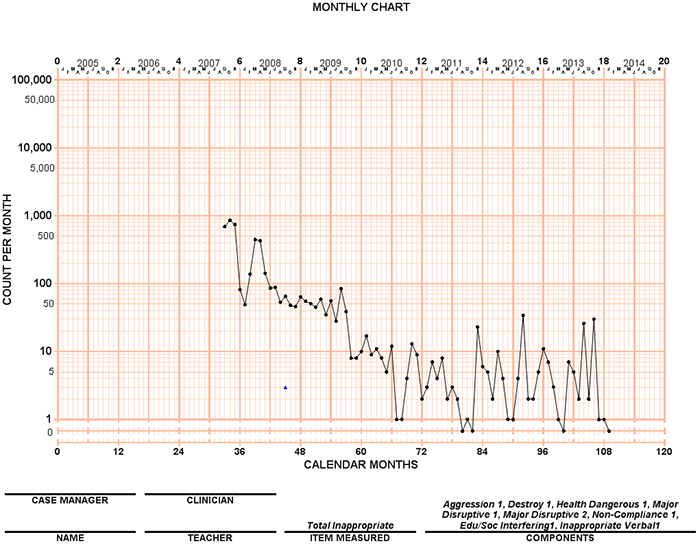
The charting application graphically displays client academic and behavioral data that we collect at the school. Academic data is collected and displayed in real time. We have students and clients work in several different educational applications throughout the school day. As he or she completes a timing, the results are written to our charting application which can be displayed instantly. Daily behavioral data is collected and entered by staff usually a day or two later. Staff use the charting application to easily monitor how the student or client is doing both academically and behaviorally.
Being able to easily access this data and being able to visually see this data is a huge help to staff in helping students and clients obtain the best care here at our school. One last benefit that I would like to add is that parents can view their child’s chart data at any time via our Parent Agency website.


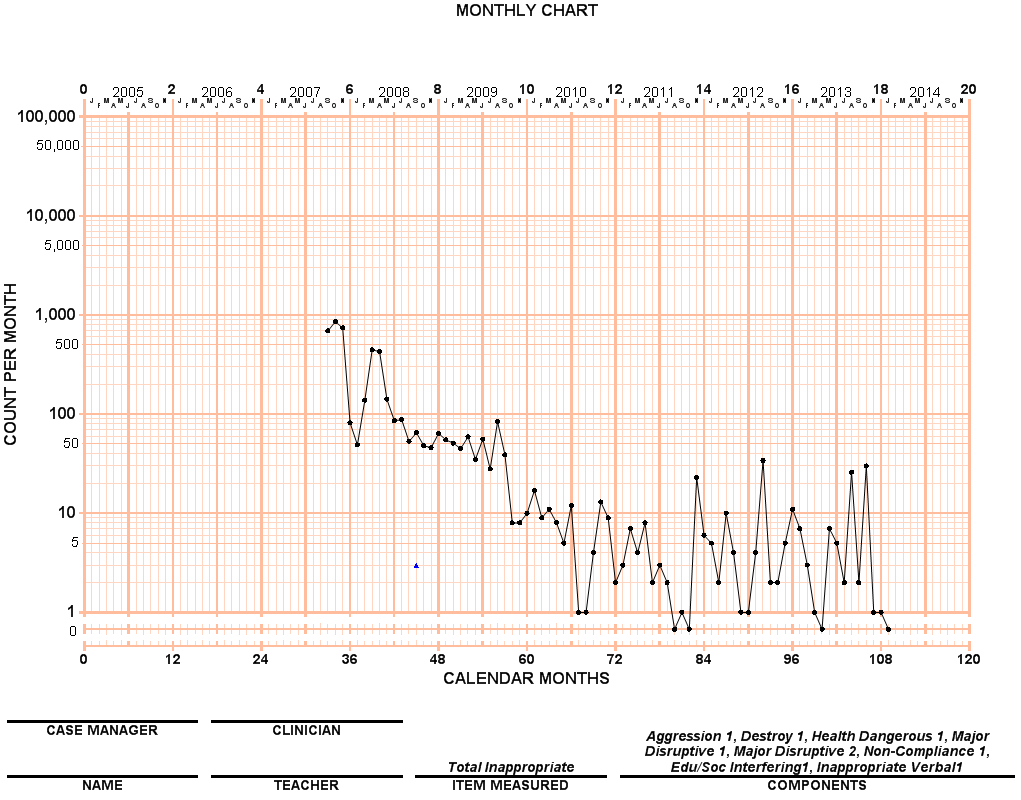
This is pretty interesting. I notice that above the components section there are a list of values, do these represent the behaviors exhibited by a student in this particular chart? Do the dots on the logarithmic chart represent a sum of all the behaviors listed in the components section?
Yes, you are correct on both counts. The chart displayed is a Total Inappropriate [behaviors] chart, which is a composite chart based on the sum of the behaviors listed in the components section. This chart happens to be a monthly chart for which each dot represents a sum of all the behaviors (listed in the components section) that a student exhibited for the month.
Cool stuff WG, Do you guys offer this software for sale?