What is Precision Teaching and how can you use it?
Precision Teaching is a measurement system that allows teachers to track what their students are learning and how they are performing. This is a great progress monitoring tool for all of you teachers out there!
This system puts the collected data onto a standard celeration chart, which gives the teacher a very clear learning picture. Teachers are trained to chart the data as well as how to interpret the data after it is placed on the chart. This allows teachers to make data-based decisions about their students’ learning.
By making these data-based decisions, the teachers can then determine if an intervention is needed and which one to use. This tool can be used in any area, for example: math facts; spelling; reading; writing; vocabulary; appropriate or inappropriate behaviors; running; toileting; smoking; daily living skills; vocational activities; and more.
In order for this system to work, a few things need to be set up:
- First, you must identify what area you want to improve or change.
- Second, the teacher must gather and arrange the materials needed.
- Third, you must set the criteria; determine the length of time that will be set when measuring the behavior; and the aim (mastery criteria) you are looking for.
When taking data, the time can be set typically from 10 seconds up to 5 minutes when charting academic behavior. The data is recorded by frequency (how many times did this behavior occur in the time frame that was set).
An example

A student was working on reading decoding skills. The goal was to read at a rate of 250 words per minute at a 3rd grade level. The student was given 3rd grade reading material. A timer was set for 1 minute; the student read for the entire minute. During this time the teacher collected the data on how many errors occurred and what specific words were incorrect.
Once the timing was done it was determined how many words were read correctly. The student read a total of 250 words and 6 were incorrect. The teacher then charted this data as 244 correct responses and 6 incorrect responses. Correct responses are marked by a dot and incorrect responses are marked by an x.
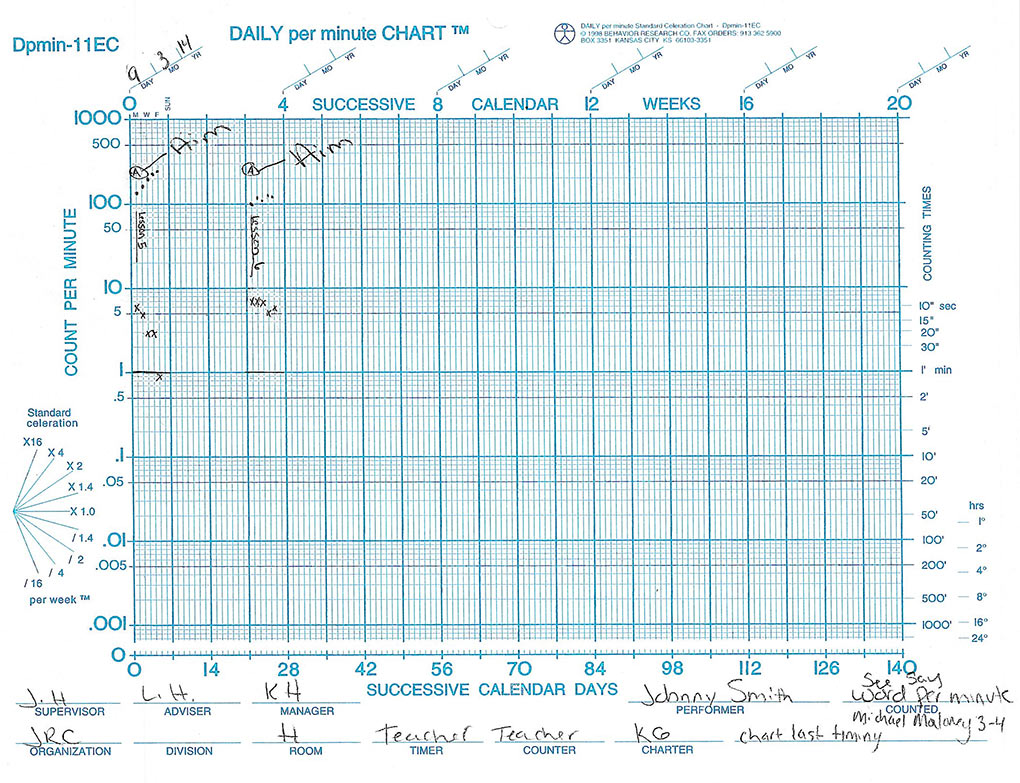
In the graph below you see two blocks of data for two different weeks. In the first block the date is marked 3/9/14. The students learning picture is very clear. The teacher set the goal for the child to read at a rate of 250 words per minute in order to move on to the next lesson.
In the first day we can see that the child was reading about 150 words per minute and had 6 incorrect responses. By the 5th day there was 250 correct responses and 0 incorrect responses. This is GREAT!!! This is was we want to see. In this situation no intervention by the teacher is needed.
In the second week of data listed (I spaced it out so it is easier to read) we see a very different picture. It is clear that the student is struggling to reach the goal. The improvement rate over the week was very small and the reduction of incorrect responses was also very small.
On the first day the student is reading at a rate of 100 words per minute and has a total of 7 errors; by the 5th day he is reading about 118 words with a total of 6 errors. So when we see this we intervene. (In our school we would actually make an intervention before day 5 but showing you all of these data points allows for my explanation to be a bit clearer.)
There are a variety of things that can be done here. One of which may be taking the words he is getting incorrect and doing a separate timing on those words specifically. Another reason this student is not making progress may be because the lesson is too hard, so he needs to move back to an earlier lesson. These are things we work with the teachers on determining; however this can be done at home as well. You can make an intervention and if it works, great – if not try something else.
I have used this method for myself in college. This is a great tool for when you need to learn a lot of terms. I can see where my errors are and I can go back and adjust the way I am practicing.
Resources
This is just the beginning of what precision teaching is and what it can be used for. There are some really great resources out there that can be used to further your understanding. Here are a few:
- Kent Johnson and Elizabeth M. Street wrote an amazing book called Response to Intervention and Precision Teaching. You can also go to Kent’s website, Morningside Academy, and see what he is doing at the school he runs. He also has educational resources available to purchase on this site.
- Another great resource is The Precision Teaching Book by Richard M. Kubina, Jr. & Kirsten K. L. Yurich.
- Another useful guide is called Standard Celeration Charting 2002, by Steve Graf and Og Lindsley. This is a really tool that is a step by step guide on how to chart data and then read the data.
- Lastly, https://celeration.org is an interesting site to join. It will allow you to see updated information regarding standard celeration charts and precision teaching.