As the Quality Control Director, it’s vitally important for me and my staff to ensure there’s a high level of continuity with student programs, company policies, and regulations.
To achieve these objectives on a daily basis, the monitoring department employs approximately 60 staff who are scheduled 24/7 at our various residences, school buildings, and areas in between. These staff are called roving monitors, and they randomly visit the classrooms and residences and any areas the students and clients frequent, and assist the residential staff as needed.
The DVR/monitoring staff are long-term employees who have previously held various positions at JRC. These staff possess good knowledge, understanding, and have a good amount of experience with the JRC program, which are strong attributes for the many functions they’re performing.
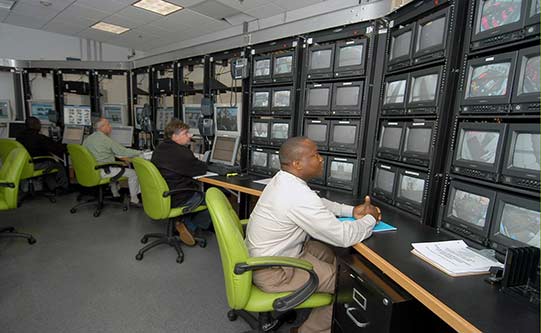
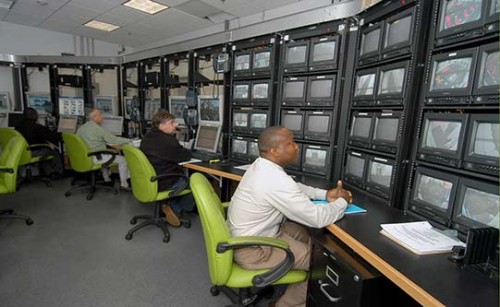
To further achieve a high level of supervision of students and staff, JRC has invested a lot of time and money in a state-of -the-art digital recording video (DVR) system.
The monitoring rooms provide 24/7 video coverage of JRC spaces.
This system houses approximately 1000 cameras which allow live-streaming 24 hours a day of all of the JRC residences and school buildings.
Because of this, the DVR/monitoring staff are able to take immediate corrective actions when any deviation is observed, and to cue or alert staff with questionable behavior(s) and so on.
The staff working in the residences and school buildings are also able reach out, at any time, by calling the monitoring/DVR office should they have any questions or require assistance.
Protecting the integrity of the JRC program and experience, and the safety and well-being of all our students and clients, as well as staff, is our top priority.
Precision Teaching is a measurement system that allows teachers to track what their students are learning and how they are performing. This is a great progress monitoring tool for all of you teachers out there!
This system puts the collected data onto a standard celeration chart, which gives the teacher a very clear learning picture. Teachers are trained to chart the data as well as how to interpret the data after it is placed on the chart. This allows teachers to make data-based decisions about their students’ learning.
By making these data-based decisions, the teachers can then determine if an intervention is needed and which one to use. This tool can be used in any area, for example: math facts; spelling; reading; writing; vocabulary; appropriate or inappropriate behaviors; running; toileting; smoking; daily living skills; vocational activities; and more.
In order for this system to work, a few things need to be set up:
First, you must identify what area you want to improve or change.
Second, the teacher must gather and arrange the materials needed.
Third, you must set the criteria; determine the length of time that will be set when measuring the behavior; and the aim (mastery criteria) you are looking for.
When taking data, the time can be set typically from 10 seconds up to 5 minutes when charting academic behavior. The data is recorded by frequency (how many times did this behavior occur in the time frame that was set).
An example
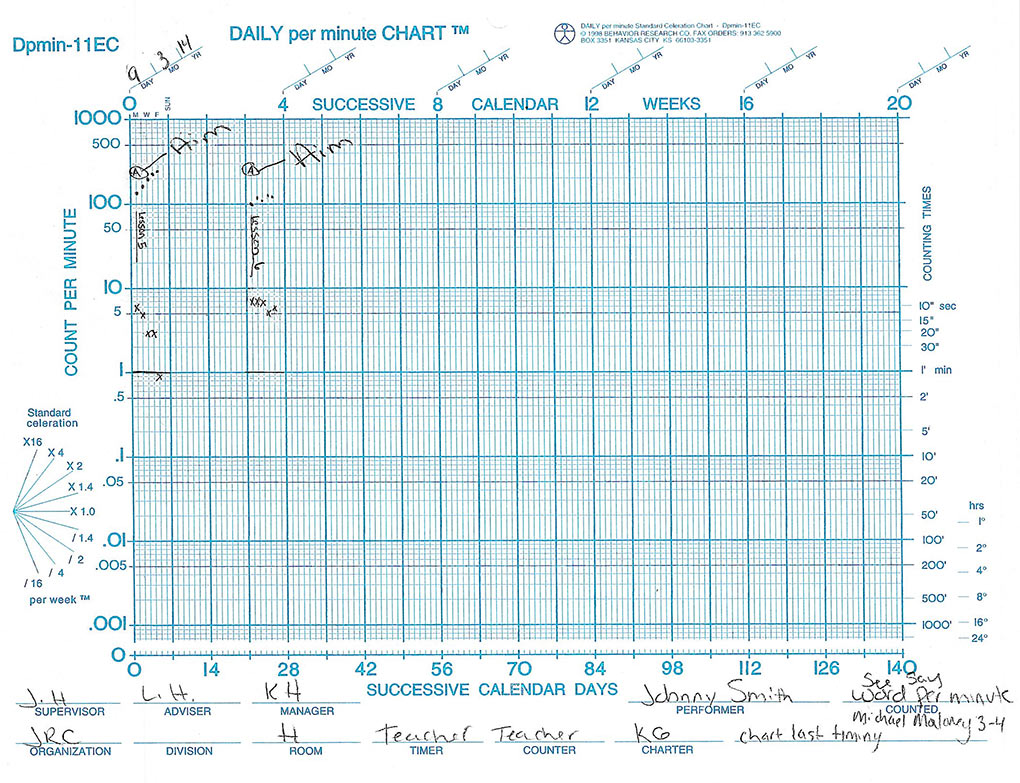
A sample standard celeration chart showing reading progress.
A student was working on reading decoding skills. The goal was to read at a rate of 250 words per minute at a 3rd grade level. The student was given 3rd grade reading material. A timer was set for 1 minute; the student read for the entire minute. During this time the teacher collected the data on how many errors occurred and what specific words were incorrect.
Once the timing was done it was determined how many words were read correctly. The student read a total of 250 words and 6 were incorrect. The teacher then charted this data as 244 correct responses and 6 incorrect responses. Correct responses are marked by a dot and incorrect responses are marked by an x.
In the graph below you see two blocks of data for two different weeks. In the first block the date is marked 3/9/14. The students learning picture is very clear. The teacher set the goal for the child to read at a rate of 250 words per minute in order to move on to the next lesson.
In the first day we can see that the child was reading about 150 words per minute and had 6 incorrect responses. By the 5th day there was 250 correct responses and 0 incorrect responses. This is GREAT!!! This is was we want to see. In this situation no intervention by the teacher is needed.
In the second week of data listed (I spaced it out so it is easier to read) we see a very different picture. It is clear that the student is struggling to reach the goal. The improvement rate over the week was very small and the reduction of incorrect responses was also very small.
On the first day the student is reading at a rate of 100 words per minute and has a total of 7 errors; by the 5th day he is reading about 118 words with a total of 6 errors. So when we see this we intervene. (In our school we would actually make an intervention before day 5 but showing you all of these data points allows for my explanation to be a bit clearer.)
There are a variety of things that can be done here. One of which may be taking the words he is getting incorrect and doing a separate timing on those words specifically. Another reason this student is not making progress may be because the lesson is too hard, so he needs to move back to an earlier lesson. These are things we work with the teachers on determining; however this can be done at home as well. You can make an intervention and if it works, great – if not try something else.
I have used this method for myself in college. This is a great tool for when you need to learn a lot of terms. I can see where my errors are and I can go back and adjust the way I am practicing.
Resources
This is just the beginning of what precision teaching is and what it can be used for. There are some really great resources out there that can be used to further your understanding. Here are a few:
Kent Johnson and Elizabeth M. Street wrote an amazing book called Response to Intervention and Precision Teaching. You can also go to Kent’s website, Morningside Academy, and see what he is doing at the school he runs. He also has educational resources available to purchase on this site.
Another useful guide is called Standard Celeration Charting 2002, by Steve Graf and Og Lindsley. This is a really tool that is a step by step guide on how to chart data and then read the data.
Lastly, https://celeration.org is an interesting site to join. It will allow you to see updated information regarding standard celeration charts and precision teaching.
I’m a software developer at JRC and I would like to briefly talk about the charting application that we have developed here at JRC that I feel greatly benefits our students and clients and our staff.
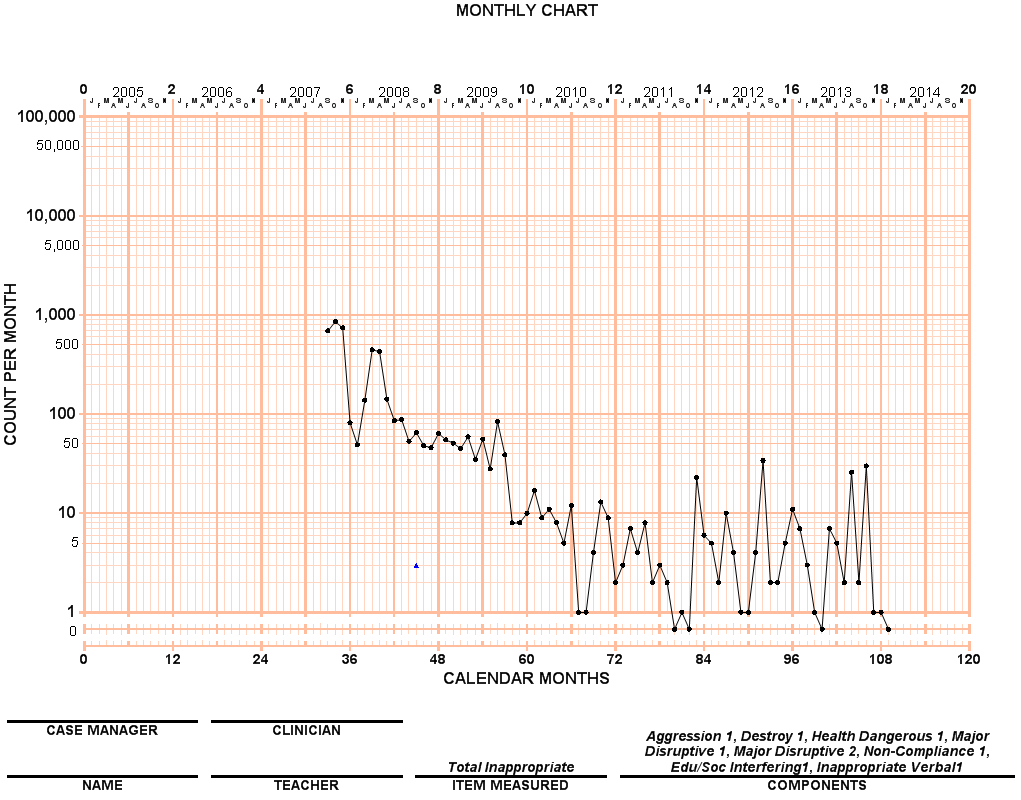
The charting application graphically displays client academic and behavioral data that we collect at the school. Academic data is collected and displayed in real time. We have students and clients work in several different educational applications throughout the school day. As he or she completes a timing, the results are written to our charting application which can be displayed instantly. Daily behavioral data is collected and entered by staff usually a day or two later. Staff use the charting application to easily monitor how the student or client is doing both academically and behaviorally.
Being able to easily access this data and being able to visually see this data is a huge help to staff in helping students and clients obtain the best care here at our school. One last benefit that I would like to add is that parents can view their child’s chart data at any time via our Parent Agency website.
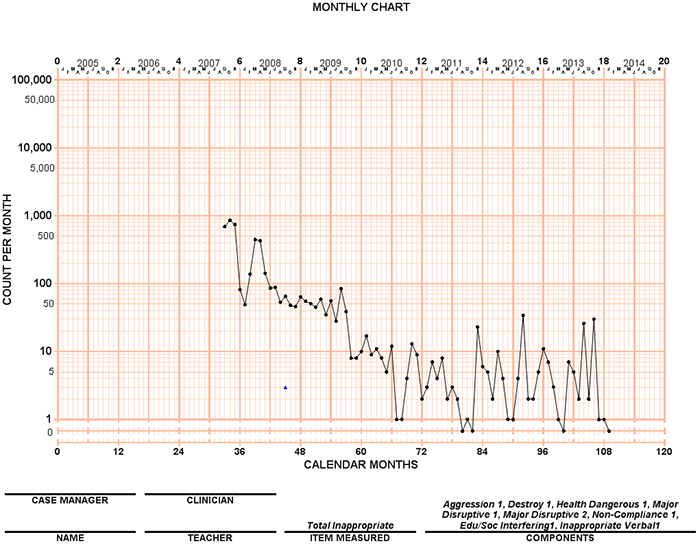
This chart shows the drop-off in this student’s inappropriate behaviors from entry to JRC to the present.
JRC has made use of custom software applications in order to maximize the work efficiency of staff and to more adequately manage big data.
Because of the large amounts of data needed to be recorded due to the nature of our business, JRC has built many systems in-house in order to manage this workload. From a scheduling system that processes a constantly changing schedule for 1000 staff at 40+ locations 24/7, to a program change application that allows clinicians and case managers to make dozens of changes per week to client’s programs, custom software has allowed the organization to more easily manage the growth of information needed to provide effective aid to our students and clients.
Let us know if you would like to learn more about some of the software programs we have been able to develop here.